1.使用效果


2.制作历程
首先我有个程序需要用到进度条,我首先试了一下MATLAB自带的进度条:
|
1
2
3
4
5
6
7
|
bar=waitbar(0,'读取数据中...'); % waitbar显示进度条
for i=1:1000
A(i)=rand();
str=['计算中...',num2str(100*i/1000),'%']; % 显示的文本
waitbar(i/1000,bar,str)
end
|

但是这样的进度条显得冷冰冰的,我就想研究一下其属性来想办法看能否对其修饰。
以前的版本系统自带的进度条可以通过。
set(findobj('type','patch'),'facecolor','b')
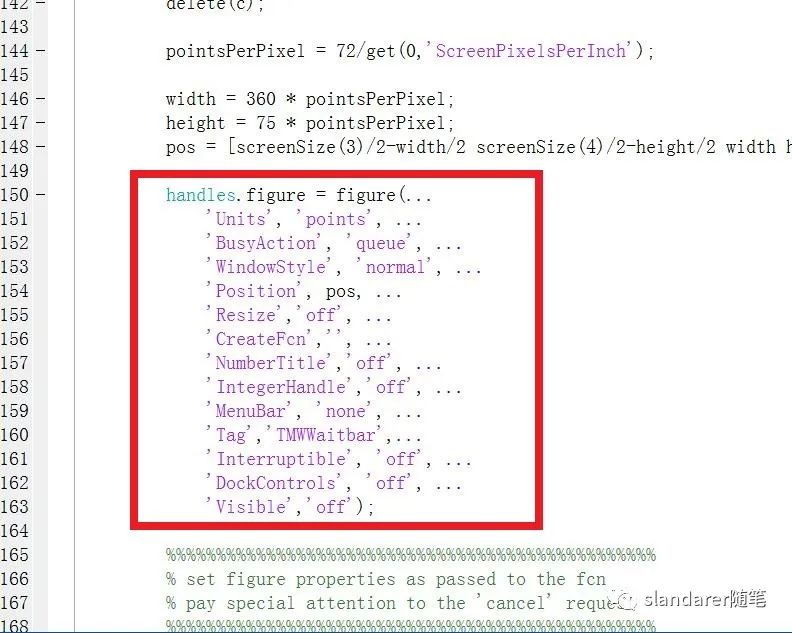
这样的方式改变颜色,但是慢慢的随着版本更新,这样的修改方式已经不行了,于是我便尝试查看新版本 waitbar 是怎样刷新进度条的,我进行了一波 open waitbar 发现这个函数就只是创建了figure和axes并不断更新图像:

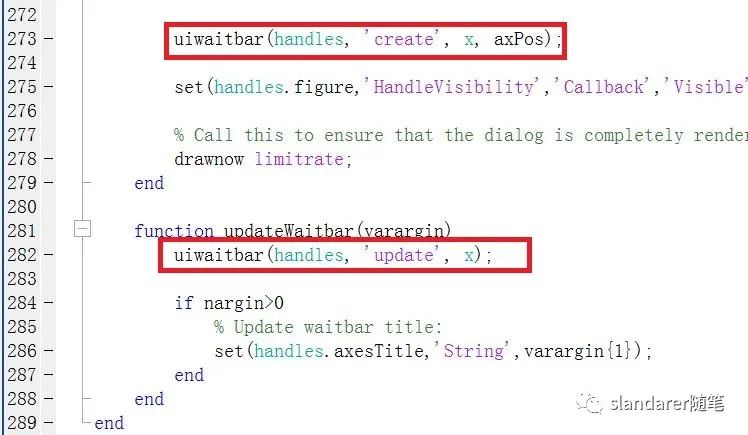
其中更新图像主要依赖一个名为 uiwaitbar 的函数:

于是我想当然的试了一下 open uiwaitbar 结果发现打不开。。。

于是我根据 waitbar.m 的位置顺藤摸瓜的在:toolbox\matlab\uitools\private
路径找到了 uiwaitbar.p 文件,啊加密文件,那没事了嗷:

虽然是加密文件,但我们还是通过换着参数调用发现这个函数可能需要用到一些png或者css文件:

不过本人css用的确实不够熟,同时也比较难看出加密文件到底是怎么调用css文件的,但是总结来说waitbar就只是一个不断刷新图像的figure而已,我们自己写的话甚至可以不用css或者png,直接用自带的画图函数都可以。
3.函数用法
写了以下几个进度条函数(四种风格):
- waitBar_SL1.m(仅支持英文)
- waitBar_SL2.m
- waitBar_SL3.m
- waitBar_SL4.m
基本用法like this:
|
1
2
3
4
5
6
7
|
bar=waitBar_SL2(0,'loading ...'); % 初始化
for i=1:1000
A(i)=rand();
str=['precess - ',num2str(round(i/10)),'%']; % 显示的文本
waitBar_SL2(bar,i/1000,str);
end
|
4.工具函数完整代码
waitBar_SL1.m

|
1
2
3
4
5
6
7
8
9
10
11
12
13
14
15
16
17
18
19
20
21
22
23
24
25
26
27
28
29
30
31
32
33
34
35
36
37
38
39
40
41
42
43
44
45
46
47
48
49
50
51
52
53
54
55
56
57
58
59
60
61
62
63
64
65
66
67
68
69
70
71
|
function barHdl=waitBar_SL1(varargin)
% @author:slandarer
%
% try this Code:
% --------------------------
% bar=waitBar_SL1(0,'loading ...'); % 初始化
%
% len=1000;
% for i=1:len
% A(i)=rand();
% str=['progress - ',num2str(round(i/len*100)),'%']; % 显示的文本
% waitBar_SL1(bar,i/len,str);
% end
% 第一次调用先创建figure和axes
if ~strcmp(get(varargin{1},'type'),'figure')
screenSize=get(0,'ScreenSize');
width=screenSize(3)*0.24;
height=screenSize(4)*0.12;
pos=[screenSize(3)/2-width/2 screenSize(4)/2-height/2 width height];
barHdl=figure();
barHdl.Position=pos;
barHdl.Resize='off';
barHdl.Name='waitbar-slandarer-type1';
barHdl.NumberTitle='off';
barHdl.IntegerHandle='off';
barHdl.MenuBar='none';
barHdl.Interruptible='off';
barHdl.DockControls='off';
barAx=axes('Parent',barHdl);
barAx.Position=[0 0 1,1];
barAx.Color=[0.99 0.96 0.95];
barAx.XColor='none';
barAx.YColor='none';
barAx.XLim=[0,105];
barAx.YLim=[0,60];
barAx.XGrid='on';
barAx.YGrid='on';
barAx.XTick=0:5:105;
barAx.YTick=0:5:60;
barAx.GridColor=[0.71 0.78 0.86];
barAx.GridAlpha=0.3;
barAx.LineWidth=1.2;
hold(barAx,'on')
rectangle(barAx,'Position',[0 0 105 38],'Curvature',0.3,'FaceColor',[0.4 0.5 1 .2],...
'LineWidth',1.5,'EdgeColor',[0.16 0.15 0.65],'AlignVertexCenters','on')
rectangle(barAx,'Position',[2.5 4 100 30],'Curvature',0.1,'FaceColor',[1 1 1 .8],...
'LineWidth',1.5,'EdgeColor',[0.16 0.15 0.65],'AlignVertexCenters','on')
barAx.UserData.Title=text(barAx,105/2,50,varargin{2},'horizontalAlignment','center',...
'FontSize',14,'FontWeight','bold','FontName','Comic Sans MS','Color',[0.16 0.15 0.65]);
barAx.UserData.RateHdl=plot(barAx,[],[],'Color',[0.16 0.15 0.65],'LineWidth',2,'Tag','rateHdl');
drawnow
else
barHdl=varargin{1};
barAx=barHdl.Children;
barAx.UserData.Title.String=varargin{3};
rate=round(varargin{2}*100/5);
if rate>0
X=(1:rate).*5;
Y=ones(1,rate);
XSet=[X-2.5;X+2.5];
YSet=[Y.*4.5;Y.*33.5];
delete(findobj('Tag','rateHdl'));
barAx.UserData.RateHdl=plot(barAx,XSet,YSet,'Color',[0.16 0.15 0.65],'LineWidth',2,'Tag','rateHdl');
end
drawnow
end
end
|
waitBar_SL2.m

|
1
2
3
4
5
6
7
8
9
10
11
12
13
14
15
16
17
18
19
20
21
22
23
24
25
26
27
28
29
30
31
32
33
34
35
36
37
38
39
40
41
42
43
44
45
46
47
48
49
50
51
52
53
54
55
56
57
58
59
60
61
62
63
64
65
66
67
68
69
70
71
72
|
function barHdl=waitBar_SL2(varargin)
% @author:slandarer
%
% try this Code:
% --------------------------
% bar=waitBar_SL2(0,'loading ...'); % 初始化
%
% len=1000;
% for i=1:len
% A(i)=rand();
% str=['progress - ',num2str(round(i/len*100)),'%']; % 显示的文本
% waitBar_SL2(bar,i/len,str);
% end
xyMin=[5,10];
xyMax=[95,25];
% 第一次调用先创建figure和axes
if ~strcmp(get(varargin{1},'type'),'figure')
screenSize=get(0,'ScreenSize');
width=screenSize(3)*0.24;
height=screenSize(4)*0.12;
pos=[screenSize(3)/2-width/2 screenSize(4)/2-height/2 width height];
barHdl=figure();
barHdl.Position=pos;
barHdl.Resize='off';
barHdl.Name='waitbar-slandarer-type2';
barHdl.NumberTitle='off';
barHdl.IntegerHandle='off';
barHdl.MenuBar='none';
barHdl.Interruptible='off';
barHdl.DockControls='off';
barAx=axes('Parent',barHdl);
barAx.Position=[0 0 1,1];
barAx.Color=[0.99 0.96 0.95];
barAx.XColor='none';
barAx.YColor='none';
barAx.XLim=[0,100];
barAx.YLim=[0,50];
hold(barAx,'on')
%0.8200 0.3300 0.1200
fill(barAx,[xyMin(1),xyMax(1),xyMax(1),xyMin(1)],...
[xyMin(2),xyMin(2),xyMax(2),xyMax(2)],[0.85 0.4 0.13].*1.1);
xSep1=5;
xSep2=3;
for i=1:9
fill(barAx,[xyMin(1),xyMin(1)+xSep1,xyMin(1)+xSep1+xSep2,xyMin(1)+xSep2]+(i-1)*10.2,...
[xyMin(2),xyMin(2),xyMax(2),xyMax(2)],[0.82 0.33 0.12],'EdgeColor','none')
end
barAx.UserData.Title=text(barAx,5,37.5,varargin{2},'horizontalAlignment','left',...
'FontSize',14,'FontWeight','bold','Color',[0.2 0.2 0.2]);
barAx.UserData.RateHdl=fill(barAx,[xyMin(1),xyMax(1),xyMax(1),xyMin(1)],...
[xyMin(2),xyMin(2),xyMax(2),xyMax(2)],...
[0.99 0.96 0.95],'EdgeColor','none');
plot(barAx,[xyMin(1),xyMin(1)]-0.8,[xyMin(2),xyMax(2)],'Color',[0.2,0.2,0.2],'LineWidth',3)
plot(barAx,[xyMax(1),xyMax(1)]+0.8,[xyMin(2),xyMax(2)],'Color',[0.2,0.2,0.2],'LineWidth',3)
plot(barAx,[xyMin(1),xyMax(1)],[xyMin(2),xyMin(2)]-1,'Color',[0.2,0.2,0.2],'LineWidth',3)
plot(barAx,[xyMin(1),xyMax(1)],[xyMax(2),xyMax(2)]+1,'Color',[0.2,0.2,0.2],'LineWidth',3)
drawnow
else
barHdl=varargin{1};
barAx=barHdl.Children;
barAx.UserData.Title.String=varargin{3};
rate=varargin{2};
xMin=rate*(xyMax(1)-xyMin(1))+xyMin(1);
barAx.UserData.RateHdl.XData=[xMin,xyMax(1),xyMax(1),xMin];
drawnow
end
end
|
waitBar_SL3.m

|
1
2
3
4
5
6
7
8
9
10
11
12
13
14
15
16
17
18
19
20
21
22
23
24
25
26
27
28
29
30
31
32
33
34
35
36
37
38
39
40
41
42
43
44
45
46
47
48
49
50
51
52
53
54
55
56
57
58
59
60
61
62
63
64
65
66
67
68
69
70
71
72
|
function barHdl=waitBar_SL3(varargin)
% @author:slandarer
%
% try this Code:
% --------------------------
% bar=waitBar_SL3(0,'loading ...'); % 初始化
%
% len=1000;
% for i=1:len
% A(i)=rand();
% str=['progress - ',num2str(round(i/len*100)),'%']; % 显示的文本
% waitBar_SL3(bar,i/len,str);
% end
xyMin=[5,10];
xyMax=[95,25];
% 第一次调用先创建figure和axes
if ~strcmp(get(varargin{1},'type'),'figure')
screenSize=get(0,'ScreenSize');
width=screenSize(3)*0.24;
height=screenSize(4)*0.12;
pos=[screenSize(3)/2-width/2 screenSize(4)/2-height/2 width height];
barHdl=figure();
barHdl.Position=pos;
barHdl.Resize='off';
barHdl.Name='waitbar-slandarer-type3';
barHdl.NumberTitle='off';
barHdl.IntegerHandle='off';
barHdl.MenuBar='none';
barHdl.Interruptible='off';
barHdl.DockControls='off';
barAx=axes('Parent',barHdl);
barAx.Position=[0 0 1,1];
barAx.Color=[0.99 0.96 0.95];
barAx.XColor='none';
barAx.YColor='none';
barAx.XLim=[0,100];
barAx.YLim=[0,50];
hold(barAx,'on')
%0.8200 0.3300 0.1200
fill(barAx,[xyMin(1),xyMax(1),xyMax(1),xyMin(1)],...
[xyMin(2),xyMin(2),xyMax(2),xyMax(2)],[0.4100 0.6200 0.15].*1.3);
xSep1=5;
xSep2=3;
for i=1:9
fill(barAx,[xyMin(1),xyMin(1)+xSep1,xyMin(1)+xSep1+xSep2,xyMin(1)+xSep2]+(i-1)*10.2,...
[xyMin(2),xyMin(2),xyMax(2),xyMax(2)],[0.47 0.66 0.12],'EdgeColor','none')
end
barAx.UserData.Title=text(barAx,5,37.5,varargin{2},'horizontalAlignment','left',...
'FontSize',14,'FontWeight','bold','Color',[0.2 0.2 0.2]);
barAx.UserData.RateHdl=fill(barAx,[xyMin(1),xyMax(1),xyMax(1),xyMin(1)],...
[xyMin(2),xyMin(2),xyMax(2),xyMax(2)],...
[0.99 0.96 0.95],'EdgeColor','none');
plot(barAx,[xyMin(1),xyMin(1)]-0.8,[xyMin(2),xyMax(2)],'Color',[0.2,0.2,0.2],'LineWidth',3)
plot(barAx,[xyMax(1),xyMax(1)]+0.8,[xyMin(2),xyMax(2)],'Color',[0.2,0.2,0.2],'LineWidth',3)
plot(barAx,[xyMin(1),xyMax(1)],[xyMin(2),xyMin(2)]-1,'Color',[0.2,0.2,0.2],'LineWidth',3)
plot(barAx,[xyMin(1),xyMax(1)],[xyMax(2),xyMax(2)]+1,'Color',[0.2,0.2,0.2],'LineWidth',3)
drawnow
else
barHdl=varargin{1};
barAx=barHdl.Children;
barAx.UserData.Title.String=varargin{3};
rate=varargin{2};
xMin=rate*(xyMax(1)-xyMin(1))+xyMin(1);
barAx.UserData.RateHdl.XData=[xMin,xyMax(1),xyMax(1),xMin];
drawnow
end
end
|
waitBar_SL4.m

|
1
2
3
4
5
6
7
8
9
10
11
12
13
14
15
16
17
18
19
20
21
22
23
24
25
26
27
28
29
30
31
32
33
34
35
36
37
38
39
40
41
42
43
44
45
46
47
48
49
50
51
52
53
54
55
56
57
58
59
60
61
62
63
64
|
function barHdl=waitBar_SL4(varargin)
% @author:slandarer
%
% try this Code:
% --------------------------
% bar=waitBar_SL4(0,'loading ...'); % 初始化
%
% len=1000;
% for i=1:len
% A(i)=rand();
% str=['progress - ',num2str(round(i/len*100)),'%']; % 显示的文本
% waitBar_SL4(bar,i/len,str);
% end
% 第一次调用先创建figure和axes
if ~strcmp(get(varargin{1},'type'),'figure')
screenSize=get(0,'ScreenSize');
width=screenSize(3)*0.18;
height=screenSize(3)*0.18;
pos=[screenSize(3)/2-width/2 screenSize(4)/2-height/2 width height];
barHdl=figure();
barHdl.Position=pos;
barHdl.Resize='off';
barHdl.Name='waitbar-type4';
barHdl.NumberTitle='off';
barHdl.IntegerHandle='off';
barHdl.MenuBar='none';
barHdl.Interruptible='off';
barHdl.DockControls='off';
barAx=axes('Parent',barHdl);
barAx.Position=[0 0 1,1];
barAx.Color=[1 1 1];
barAx.XColor='none';
barAx.YColor='none';
barAx.XLim=[0,100];
barAx.YLim=[0,100];
hold(barAx,'on')
t=linspace(0,-2*pi,pi/(pi/500))+pi/2;
xSet=cos(t);
ySet=sin(t);
fill(barAx,[xSet.*35,xSet(end:-1:1).*45]+50,...
[ySet.*35,ySet(end:-1:1).*45]+50,[1 1 1].*0.93,'EdgeColor','none');
barAx.UserData.Title=text(barAx,50,50,varargin{2},'horizontalAlignment','center',...
'FontSize',14,'FontWeight','bold','Color',[0.2 0.2 0.2]);
barAx.UserData.RateHdl=fill(barAx,[0 0 0 0],...
[0 0 0 0],...
[0.53 0.81 0.93],'EdgeColor','none');
drawnow
else
barHdl=varargin{1};
barAx=barHdl.Children;
barAx.UserData.Title.String=varargin{3};
rate=varargin{2}*2*pi;
t=linspace(0,-rate,rate/(pi/500))+pi/2;
xSet=cos(t);
ySet=sin(t);
barAx.UserData.RateHdl.XData=[xSet.*35,xSet(end:-1:1).*45]+50;
barAx.UserData.RateHdl.YData=[ySet.*35,ySet(end:-1:1).*45]+50;
drawnow
end
end
|
5.下载地址
http://xiazai.jb51.net/202202/yuanma/jindutiao_jb51.rar
|