grid()函数概述
grid()函数用于设置绘图区网格线。
grid()的函数签名为matplotlib.pyplot.grid(b=None, which='major', axis='both', **kwargs)。
grid()的参数如下:
-
b:是否显示网格线。布尔值或None,可选参数。如果没有关键字参数,则b为True,如果b为None且没有关键字参数,相当于切换网格线的可见性。
-
which:网格线显示的尺度。字符串,可选参数,取值范围为{'major', 'minor', 'both'},默认为'both'。'major'为主刻度、'minor'为次刻度。
-
axis:选择网格线显示的轴。字符串,可选参数,取值范围为{'both', 'x', 'y'},默认为'both'`。
-
**kwargs:Line2D线条对象属性。
grid()的返回值为None。
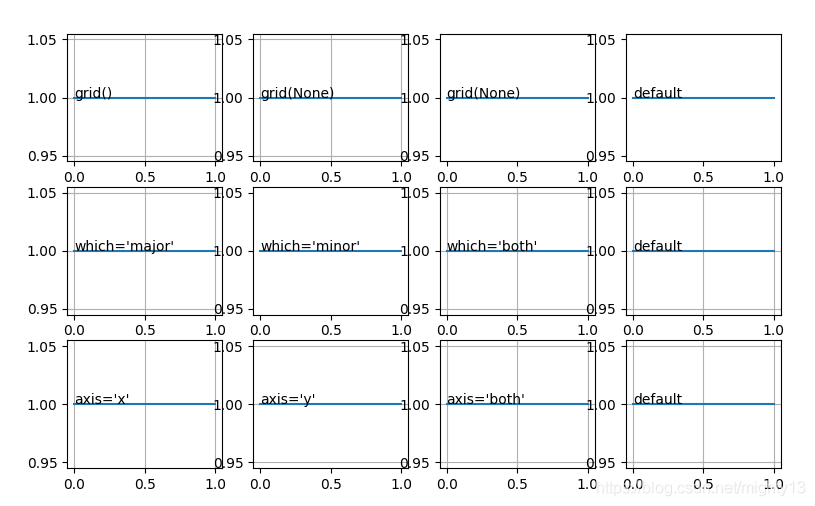
grid()函数演示
import matplotlib.pyplot as plt

plt.subplot(341)
# grid()默认样式
plt.plot([1, 1])
plt.grid()
plt.annotate('grid()', (0, 1))
plt.subplot(342)
# 因为默认没有网格线,所以grid(None)显示网格线
plt.plot([1, 1])
plt.grid(None)
plt.annotate('grid(None)', (0, 1))
plt.subplot(343)
# 因为设置了网格线,所以grid(None)切换为不显示网格线
plt.plot([1, 1])
plt.grid(True)
plt.grid(None)
plt.annotate('grid(None)', (0, 1))
plt.subplot(344)
# 因为默认没有网格线
plt.plot([1, 1])
plt.annotate("default", (0, 1))
plt.subplot(345)
# 只显示主刻度网格线
plt.plot([1, 1])
plt.grid(which='major')
plt.annotate("which='major'", (0, 1))
plt.subplot(346)
# 只显示次刻度网格线,因为没有次刻度,所以无网格线
plt.plot([1, 1])
plt.grid(which='minor')
plt.annotate("which='minor'", (0, 1))
plt.subplot(347)
# 同时显示主刻度、次刻度网格线
plt.plot([1, 1])
plt.grid(which='both')
plt.annotate("which='both'", (0, 1))
plt.subplot(348)
plt.plot([1, 1])
# 默认同时显示主刻度、次刻度网格线
plt.grid()
plt.annotate("default", (0, 1))
plt.subplot(349)
# 只显示x轴网格线
plt.plot([1, 1])
plt.grid(axis='x')
plt.annotate("axis='x'", (0, 1))
plt.subplot(3,4,10)
# 只显示y轴网格线
plt.plot([1, 1])
plt.grid(axis='y')
plt.annotate("axis='y'", (0, 1))
plt.subplot(3,4,11)
# 同时显示xy轴网格线
plt.plot([1, 1])
plt.grid(axis='both')
plt.annotate("axis='both'", (0, 1))
plt.subplot(3,4,12)
# 默认显示xy轴网格线
plt.plot([1, 1])
plt.grid()
plt.annotate("default", (0, 1))
plt.show()
|
原理
pyplot.grid()其实调用的是gca().grid(),即Aexs.grid()。
底层相关函数有:
Axis.grid()
Axes.grid()源码(matplotlib/Axes/_base.py)
def grid(self, b=None, which='major', axis='both', **kwargs):
    cbook._check_in_list(['x', 'y', 'both'], axis=axis)
    if axis in ['x', 'both']:
      self.xaxis.grid(b, which=which, **kwargs)
    if axis in ['y', 'both']:
      self.yaxis.grid(b, which=which, **kwargs)
|
xaxis 为XAxis类的实例,yaxis为YAxis类的实例,XAxis和YAxis类的基类为Axis。
Axis.grid()源码(matplotlib/axis.py)
def grid(self, b=None, which='major', **kwargs):
  if b is not None:
    if 'visible' in kwargs and bool(b) != bool(kwargs['visible']):
      raise ValueError(
        "'b' and 'visible' specify inconsistent grid visibilities")
    if kwargs and not b: # something false-like but not None
      cbook._warn_external('First parameter to grid() is false, '
                 'but line properties are supplied. The '
                 'grid will be enabled.')
      b = True
  which = which.lower()
  cbook._check_in_list(['major', 'minor', 'both'], which=which)
  gridkw = {'grid_' + item[0]: item[1] for item in kwargs.items()}
  if 'grid_visible' in gridkw:
    forced_visibility = True
    gridkw['gridOn'] = gridkw.pop('grid_visible')
  else:
    forced_visibility = False

  if which in ['minor', 'both']:
    if b is None and not forced_visibility:
      gridkw['gridOn'] = not self._minor_tick_kw['gridOn']
    elif b is not None:
      gridkw['gridOn'] = b
    self.set_tick_params(which='minor', **gridkw)
  if which in ['major', 'both']:
    if b is None and not forced_visibility:
      gridkw['gridOn'] = not self._major_tick_kw['gridOn']
    elif b is not None:
      gridkw['gridOn'] = b
    self.set_tick_params(which='major', **gridkw)
  self.stale = True
|
|