桑基图简介
很多时候,我们需要一种必须可视化数据如何在实体之间流动的情况。例如,以居民如何从一个国家迁移到另一个国家为例。这里演示了有多少居民从英格兰迁移到北爱尔兰、苏格兰和威尔士。
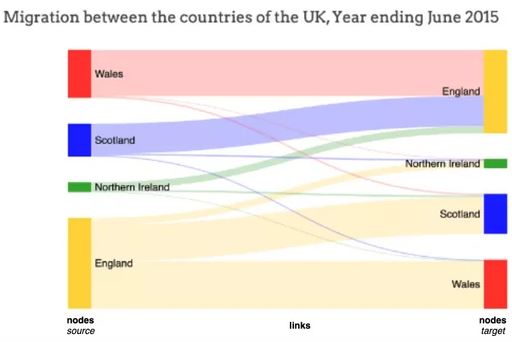
从这个 桑基图 (Sankey)可视化中可以明显看出,从England迁移到Wales的居民多于从Scotland或Northern Ireland迁移的居民。
什么是桑基图?
桑基图通常描绘 从一个实体(或节点)到另一个实体(或节点)的数据流。
数据流向的实体被称为节点,数据流起源的节点是源节点(例如左侧的England),流结束的节点是 目标节点(例如右侧的Wales)。源节点和目标节点通常表示为带有标签的矩形。
流动本身由直线或曲线路径表示,称为链接。流/链接的宽度与流的量/数量成正比。在上面的例子中,从英格兰到威尔士的流动(即居民迁移)比从英格兰到苏格兰或北爱尔兰的流动(即居民迁移)更广泛(更多),表明迁移到威尔士的居民数量多于其他国家。
桑基图可用于表示能量、金钱、成本的流动,以及任何具有流动概念的事物。
米纳尔关于拿破仑入侵俄罗斯的经典图表可能是桑基图表最著名的例子。这种使用桑基图的可视化非常有效地显示了法国军队在前往俄罗斯和返回的途中是如何进步(或减少?)的。

本文中,我们使用 python的plotly绘制桑基图。
如何绘制桑基图?
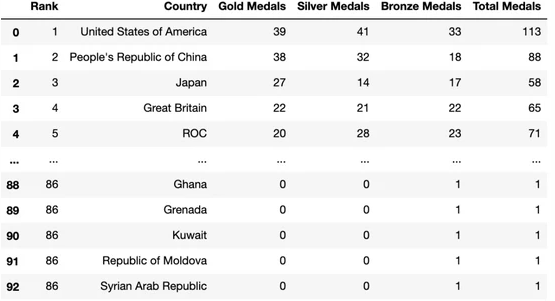
本文使用 2021 年奥运会数据集绘制桑基图。该数据集包含有关奖牌总数的详细信息——国家、奖牌总数以及金牌、银牌和铜牌的单项总数。我们通过绘制一个桑基图来了解一个国家赢得的金牌、银牌和铜牌数。
|
1
2
3
4
5
6
|
df_medals = pd.read_excel("data/Medals.xlsx")
print(df_medals.info())
df_medals.rename(columns={'Team/NOC':'Country', 'Total': 'Total Medals', 'Gold':'Gold Medals', 'Silver': 'Silver Medals', 'Bronze': 'Bronze Medals'}, inplace=True)
df_medals.drop(columns=['Unnamed: 7','Unnamed: 8','Rank by Total'], inplace=True)
df_medals
|
|
1
2
3
4
5
6
7
8
9
10
11
12
13
14
15
16
17
|
<class 'pandas.core.frame.DataFrame'>
RangeIndex: 93 entries, 0 to 92
Data columns (total 9 columns):
# Column Non-Null Count Dtype
--- ------ -------------- -----
0 Rank 93 non-null int64
1 Team/NOC 93 non-null object
2 Gold 93 non-null int64
3 Silver 93 non-null int64
4 Bronze 93 non-null int64
5 Total 93 non-null int64
6 Rank by Total 93 non-null int64
7 Unnamed: 7 0 non-null float64
8 Unnamed: 8 1 non-null float64
dtypes: float64(2), int64(6), object(1)
memory usage: 6.7+ KB
None
|
桑基图绘图基础
使用 plotly 的 go.Sankey,该方法带有2 个参数 ——nodes 和 links (节点和链接)。
注意:所有节点——源和目标都应该有唯一的标识符。
在本文奥林匹克奖牌数据集情况中:
Source是国家。将前 3 个国家(美国、中国和日本)视为源节点。用以下(唯一的)标识符、标签和颜色来标记这些源节点:
Target是金牌、银牌或铜牌。用以下(唯一的)标识符、标签和颜色来标记这些目标节点:
Link(源节点和目标节点之间)是每种类型奖牌的数量。在每个源中有3个链接,每个链接都以目标结尾——金牌、银牌和铜牌。所以总共有9个链接。每个环节的宽度应为金牌、银牌和铜牌的数量。用以下源标记这些链接到目标、值和颜色:
- 0 (美国) 至 3,4,5 : 39, 41, 33
- 1 (中国) 至 3,4,5 : 38, 32, 18
- 2 (日本) 至 3,4,5 : 27, 14, 17
需要实例化 2 个 python dict 对象来表示
- nodes (源和目标):标签和颜色作为单独的列表和
- links:源节点、目标节点、值(宽度)和链接的颜色作为单独的列表
并将其传递给plotly的 go.Sankey。
列表的每个索引(标签、源、目标、值和颜色)分别对应一个节点或链接。
|
1
2
3
4
5
6
7
8
9
10
11
12
13
14
15
16
17
|
NODES = dict(
# 0 1 2 3 4 5
label = ["United States of America", "People's Republic of China", "Japan", "Gold", "Silver", "Bronze"],
color = ["seagreen", "dodgerblue", "orange", "gold", "silver", "brown" ],)
LINKS = dict(
source = [ 0, 0, 0, 1, 1, 1, 2, 2, 2], # 链接的起点或源节点
target = [ 3, 4, 5, 3, 4, 5, 3, 4, 5], # 链接的目的地或目标节点
value = [ 39, 41, 33, 38, 32, 18, 27, 14, 17], # 链接的宽度(数量)
# 链接的颜色
# 目标节点: 3-Gold 4-Silver 5-Bronze
color = [
"lightgreen", "lightgreen", "lightgreen", # 源节点:0 - 美国 States of America
"lightskyblue", "lightskyblue", "lightskyblue", # 源节点:1 - 中华人民共和国China
"bisque", "bisque", "bisque"],) # 源节点:2 - 日本
data = go.Sankey(node = NODES, link = LINKS)
fig = go.Figure(data)
fig.show()
|

这是一个非常基本的桑基图。但是否注意到图表太宽并且银牌出现在金牌之前?
接下来介绍如何调整节点的位置和宽度。
调整节点位置和图表宽度
为节点添加 x 和 y 位置以明确指定节点的位置。值应介于 0 和 1 之间。
|
1
2
3
4
5
6
7
8
9
10
|
NODES = dict(
# 0 1 2 3 4 5
label = ["United States of America", "People's Republic of China", "Japan", "Gold", "Silver", "Bronze"],
color = ["seagreen", "dodgerblue", "orange", "gold", "silver", "brown" ],)
x = [ 0, 0, 0, 0.5, 0.5, 0.5],
y = [ 0, 0.5, 1, 0.1, 0.5, 1],)
data = go.Sankey(node = NODES, link = LINKS)
fig = go.Figure(data)
fig.update_layout(title="Olympics - 2021: Country & Medals", font_size=16)
fig.show()
|
于是得到了一个紧凑的桑基图:
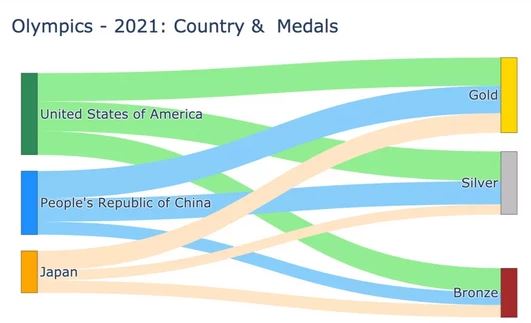
下面看看代码中传递的各种参数如何映射到图中的节点和链接。
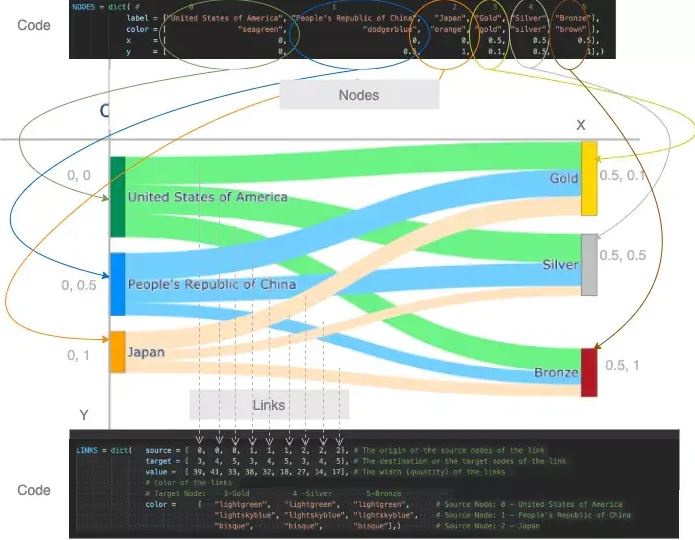
代码如何映射到桑基图
添加有意义的悬停标签
我们都知道plotly绘图是交互的,我们可以将鼠标悬停在节点和链接上以获取更多信息。
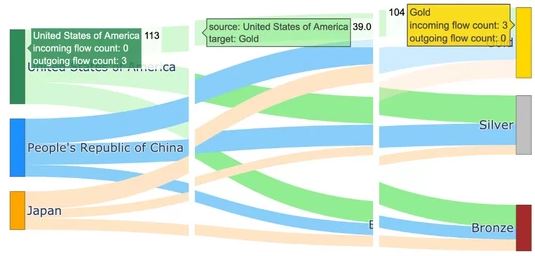
带有默认悬停标签的桑基图
当将鼠标悬停在图上,将会显示详细信息。悬停标签中显示的信息是默认文本:节点、节点名称、传入流数、传出流数和总值。
例如:
- 节点美国共获得11枚奖牌(=39金+41银+33铜)
- 节点金牌共有104枚奖牌(=美国39枚,中国38枚,日本27枚)
如果我们觉得这些标签太冗长了,我们可以对此进程改进。使用hovertemplate参数改进悬停标签的格式
- 对于节点,由于hoverlabels 没有提供新信息,通过传递一个空hovertemplate = ""来去掉hoverlabel
- 对于链接,可以使标签简洁,格式为-
- 对于节点和链接,让我们使用后缀"Medals"显示值。例如 113 枚奖牌而不是 113 枚。这可以通过使用具有适当valueformat和valuesuffix的update_traces函数来实现。
|
1
2
3
4
5
6
7
8
9
10
11
12
13
14
15
16
17
18
19
20
21
22
23
24
25
26
27
28
29
30
31
32
33
34
35
36
37
|
NODES = dict(
# 0 1 2 3 4 5
label = ["United States of America", "People's Republic of China", "Japan", "Gold", "Silver", "Bronze"],
color = [ "seagreen", "dodgerblue", "orange", "gold", "silver", "brown" ],
x = [ 0, 0, 0, 0.5, 0.5, 0.5],
y = [ 0, 0.5, 1, 0.1, 0.5, 1],
hovertemplate=" ",)
LINK_LABELS = []
for country in ["USA","China","Japan"]:
for medal in ["Gold","Silver","Bronze"]:
LINK_LABELS.append(f"{country}-{medal}")
LINKS = dict(source = [ 0, 0, 0, 1, 1, 1, 2, 2, 2],
# 链接的起点或源节点
target = [ 3, 4, 5, 3, 4, 5, 3, 4, 5],
# 链接的目的地或目标节点
value = [ 39, 41, 33, 38, 32, 18, 27, 14, 17],
# 链接的宽度(数量)
# 链接的颜色
# 目标节点:3-Gold 4 -Silver 5-Bronze
color = ["lightgreen", "lightgreen", "lightgreen", # 源节点:0 - 美国
"lightskyblue", "lightskyblue", "lightskyblue", # 源节点:1 - 中国
"bisque", "bisque", "bisque"], # 源节点:2 - 日本
label = LINK_LABELS,
hovertemplate="%{label}",)
data = go.Sankey(node = NODES, link = LINKS)
fig = go.Figure(data)
fig.update_layout(title="Olympics - 2021: Country & Medals",
font_size=16, width=1200, height=500,)
fig.update_traces(valueformat='3d',
valuesuffix='Medals',
selector=dict(type='sankey'))
fig.update_layout(hoverlabel=dict(bgcolor="lightgray",
font_size=16,
font_family="Rockwell"))
fig.show("png") #fig.show()
|
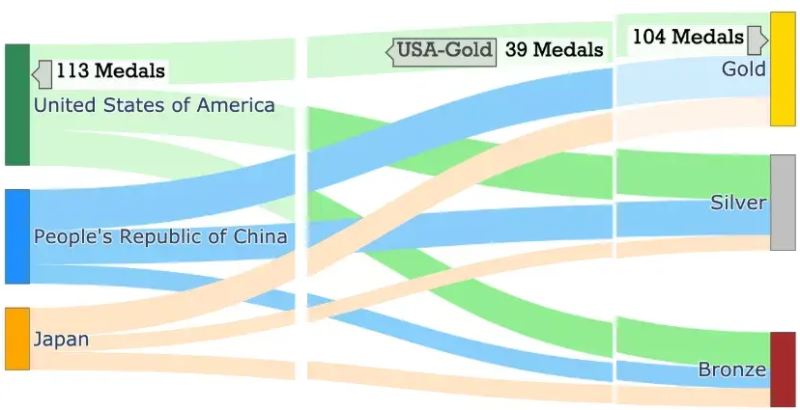
带有改进的悬停标签的桑基图
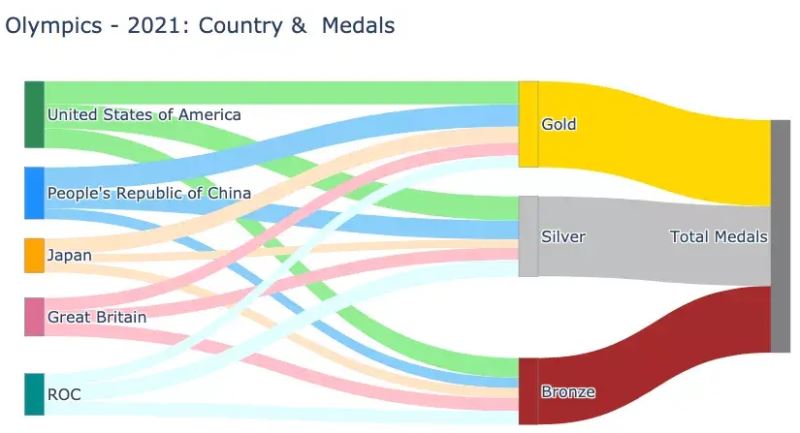
对多个节点和级别进行泛化相对于链接,节点被称为源和目标。作为一个链接目标的节点可以是另一个链接的源。
该代码可以推广到处理数据集中的所有国家。
还可以将图表扩展到另一个层次,以可视化各国的奖牌总数。
|
1
2
3
4
5
6
7
8
9
10
11
12
13
14
15
16
17
18
19
20
21
22
23
24
25
26
27
28
29
30
31
32
33
34
35
36
37
38
39
40
41
42
43
44
45
46
|
NUM_COUNTRIES = 5
X_POS, Y_POS = 0.5, 1/(NUM_COUNTRIES-1)
NODE_COLORS = ["seagreen", "dodgerblue", "orange", "palevioletred", "darkcyan"]
LINK_COLORS = ["lightgreen", "lightskyblue", "bisque", "pink", "lightcyan"]
source = []
node_x_pos, node_y_pos = [], []
node_labels, node_colors = [], NODE_COLORS[0:NUM_COUNTRIES]
link_labels, link_colors, link_values = [], [], []
# 第一组链接和节点
for i in range(NUM_COUNTRIES):
source.extend([i]*3)
node_x_pos.append(0.01)
node_y_pos.append(round(i*Y_POS+0.01,2))
country = df_medals['Country'][i]
node_labels.append(country)
for medal in ["Gold", "Silver", "Bronze"]:
link_labels.append(f"{country}-{medal}")
link_values.append(df_medals[f"{medal} Medals"][i])
link_colors.extend([LINK_COLORS[i]]*3)
source_last = max(source)+1
target = [ source_last, source_last+1, source_last+2] * NUM_COUNTRIES
target_last = max(target)+1
node_labels.extend(["Gold", "Silver", "Bronze"])
node_colors.extend(["gold", "silver", "brown"])
node_x_pos.extend([X_POS, X_POS, X_POS])
node_y_pos.extend([0.01, 0.5, 1])
# 最后一组链接和节点
source.extend([ source_last, source_last+1, source_last+2])
target.extend([target_last]*3)
node_labels.extend(["Total Medals"])
node_colors.extend(["grey"])
node_x_pos.extend([X_POS+0.25])
node_y_pos.extend([0.5])
for medal in ["Gold","Silver","Bronze"]:
link_labels.append(f"{medal}")
link_values.append(df_medals[f"{medal} Medals"][:i+1].sum())
link_colors.extend(["gold", "silver", "brown"])
print("node_labels", node_labels)
print("node_x_pos", node_x_pos); print("node_y_pos", node_y_pos)
|
|
1
2
3
4
5
|
node_labels ['United States of America', "People's Republic of China",
'Japan', 'Great Britain', 'ROC', 'Gold', 'Silver',
'Bronze', 'Total Medals']
node_x_pos [0.01, 0.01, 0.01, 0.01, 0.01, 0.5, 0.5, 0.5, 0.75]
node_y_pos [0.01, 0.26, 0.51, 0.76, 1.01, 0.01, 0.5, 1, 0.5]
|
|
1
2
3
4
5
6
7
8
9
10
11
12
13
14
15
16
17
18
19
20
21
22
23
24
25
26
27
28
29
30
|
# 显示的图
NODES = dict(pad = 20, thickness = 20,
line = dict(color = "lightslategrey",
width = 0.5),
hovertemplate=" ",
label = node_labels,
color = node_colors,
x = node_x_pos,
y = node_y_pos, )
LINKS = dict(source = source,
target = target,
value = link_values,
label = link_labels,
color = link_colors,
hovertemplate="%{label}",)
data = go.Sankey(arrangement='snap',
node = NODES,
link = LINKS)
fig = go.Figure(data)
fig.update_traces(valueformat='3d',
valuesuffix=' Medals',
selector=dict(type='sankey'))
fig.update_layout(title="Olympics - 2021: Country & Medals",
font_size=16,
width=1200,
height=500,)
fig.update_layout(hoverlabel=dict(bgcolor="grey",
font_size=14,
font_family="Rockwell"))
fig.show("png")
|
|