前言 动画是使可视化更具吸引力和用户吸引力的好方法。它帮助我们以有意义的方式展示数据可视化。Python 帮助我们使用现有的强大 Python 库创建动画可视化。Matplotlib是一个非常流行
前言动画是使可视化更具吸引力和用户吸引力的好方法。它帮助我们以有意义的方式展示数据可视化。Python 帮助我们使用现有的强大 Python 库创建动画可视化。Matplotlib是一个非常流行的数据可视化库,通常用于数据的图形表示以及使用内置函数的动画。 使用 Matplotlib 创建动画有两种方法:
方法一:使用 pause() 函数在暂停()的matplotlib库的pyplot模块在功能上用于暂停为参数提到间隔秒。考虑下面的示例,我们将使用 matplotlib 创建一个简单的线性图并在其中显示动画: 创建 2 个数组 X 和 Y,并存储从 1 到 100 的值。 使用 plot() 函数绘制 X 和 Y。 以合适的时间间隔添加 pause() 函数 运行程序,你会看到动画。 Python
输出 :
同样,你也可以使用 pause() 函数在各种绘图中创建动画。 方法二:使用 FuncAnimation() 函数这个FuncAnimation() 函数不会自己创建动画,而是从我们传递的一系列图形中创建动画。 语法: FuncAnimation(figure, animation_function, frames=None, init_func=None, fargs=None, save_count=None, *, cache_frame_data=True, 现在您可以使用 FuncAnimation 函数制作多种类型的动画: 线性图动画在这个例子中,我们将创建一个简单的线性图,它将显示一条线的动画。同样,使用 FuncAnimation,我们可以创建多种类型的动画视觉表示。我们只需要在一个函数中定义我们的动画,然后用合适的参数将它传递给FuncAnimation。 Python
输出:
Python 中的条形图追赶动画在此示例中,我们将创建一个简单的条形图动画,它将显示每个条形的动画。 Python
输出:
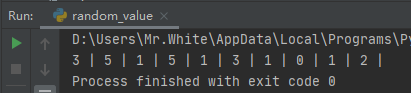
Python 中的散点图动画:在这个例子中,我们将使用随机函数在 python 中动画散点图。我们将遍历animation_func并在迭代时绘制 x 和 y 轴的随机值。
输出:
条形图追赶的水平移动在这里,我们将使用城市数据集中的最高人口绘制条形图竞赛。 不同的城市会有不同的条形图,条形图追赶将从 1990 年到 2018 年迭代。 我从人口最多的数据集中选择了最高城市的国家。 需要用到的数据集可以从这里下载:city_populations Python
输出:
|


2019-06-18
2019-07-04
2021-05-23
2021-05-27
2021-05-27