前言
区域地图选区域时,需要弹窗展示数据,样式是各种各样的,各种排列的数据、图文混搭、视频......这里除了封装echarts区域地图模块,还介绍了下自定义弹窗的实现、自定义弹窗动态加载接口数据的方式
能学到的知识
- 1、echarts地图模块封装,可复用
- 2、echarts地图自定义弹窗(显示自定义样式、自定义数据、自定义图片),其它图表的自定义弹窗可参考。
- 3、echarts地图自定义弹窗动态展示接口数据
- 4、基于姐姐篇实现的,这个地图模块也是自适应的
- 5、基于vue2 、vue cli3、echarts 5
效果图
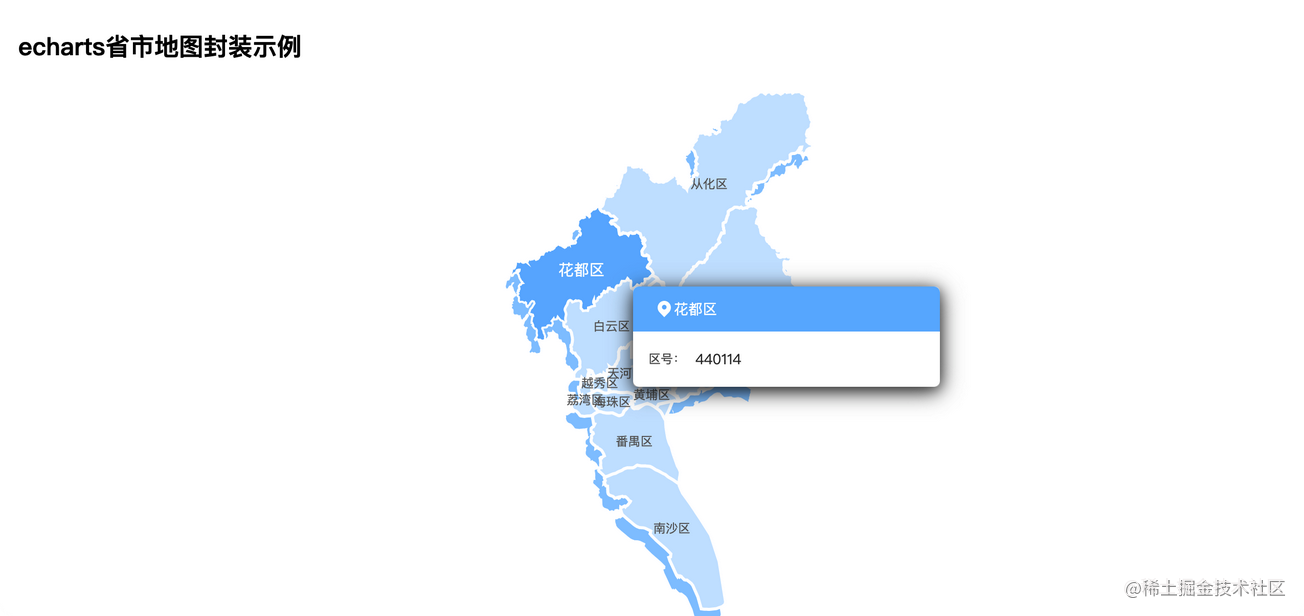
先上个效果图吧,说明下实现的效果。
- 1、广州区域地图
- 2、自定义弹窗,显示选中地区的名称、区号,弹窗加了个小图片
- 3、基本上图片、视频什么的,都可以在自定义弹窗上显示,这里只展示下自定义弹窗加图片的方式,视频同理的,不介绍了,有兴趣自己随便试试就好
- 4、弹窗数据是从模拟接口取的
注意
1、vue中echarts 5.x以下版本和5.x以上版本引入的区别
5.x以下版本
|
1 |
import echarts from 'echarts' |
5.x以上版本
|
1 |
import * as echarts from 'echarts' |
2、记得在vue.config.js中开启运行时编译功能
|
1 |
runtimeCompiler: true |
实现
数据准备
|
1 2 3 4 5 6 |
|-- public |-- data |-- 4401.json |-- mapdata.json |-- images |-- map-ic.png |
- 1、4401.json是广州区域的geojson数据,用来给echarts显示广州的区域地图
- 2、mapdata.json是模拟接口请求的假数据,自己随便自定义了,在获取数据后,看情况处理下传到封装好的echarts地图模块就行,这里模拟接口请求的知识可参考这里: vue本地模拟服务器请求mock数据
- 3、map-ic.png地图自定义弹窗用到的图片
echarts地图模块封装
|
1 2 3 4 5 6 |
|-- src |-- components |-- chart |-- options // 存放各种图表的option |-- map // 地图option |-- index.js |
具体代码如下:
|
1 2 3 4 5 6 7 8 9 10 11 12 13 14 15 16 17 18 19 20 21 22 23 24 25 26 27 28 29 30 31 32 33 34 35 36 37 38 39 40 41 42 43 44 45 46 47 48 49 50 51 52 53 54 55 56 57 58 59 60 61 62 63 64 65 66 67 68 69 70 71 72 73 74 75 76 77 78 79 80 81 82 83 84 85 86 87 88 89 90 91 92 93 94 95 96 97 98 99 100 101 102 103 104 |
import * as echarts from 'echarts'
const getSimpleMap = (jsonMap, data, config) => { if (!echarts.getMap(jsonMap.mark)) { echarts.registerMap(jsonMap.mark, jsonMap.json) } const defaultConfig = { tooltip: { // 窗口外框 trigger: 'item', padding: 0, borderWidth: 0, borderColor: '#FFFFFF', backgroundColor: '#FFFFFF', formatter: (params) => { const { data } = params const str = `<div style="width:300px;height: 98px;box-shadow: 0px 4px 20px 0px rgba(0, 0, 0, 0.8); color: #fff;text-align:left;border-radius: 6px;"> <div style="background-color: rgba(102, 182, 255, 1);height: 44px;line-height: 44px;font-size:14px;font-weight:400;border-top-left-radius: 6px;border-top-right-radius: 6px;display: flex;align-items: center;"> <img style="width: 13px;height:16px;margin-left: 24px;margin-right: 3px;" src="images/map-ic.png">${data.name} </div> <div style="width: 100%;height:54px;display: flex;flex-wrap: wrap;"> <div style="display: flex;justify-content: space-between;width: 100%;padding-left:15px;padding-right: 15px;"> <div style="display:flex;align-items:center;width:132px;"> <div style="font-size: 12px;color: #555555;margin-right:10px;">区号:</div> <div style="font-size: 14px;color: #333333;">${data.hoverObj == null ? '' : data.hoverObj.adcode}</div> </div> </div> </div> </div>` return str } }, geo: { map: jsonMap.mark, type: 'map', layoutCenter: ['50%', '50%'], layoutSize: '150%', zoom: 0.65, roam: false, itemStyle: { normal: { areaColor: 'rgba(201, 229, 255, 1)', shadowColor: 'rgba(142, 201, 255, 1)', shadowOffsetX: -5, shadowOffsetY: 12 } } }, series: [ { type: 'map', map: jsonMap.mark, // 自定义扩展图表类型 zoom: 0.65, // 缩放 animationDuration: 1200, itemStyle: { // 地图样式 normal: { borderColor: '#FFFFFF', borderWidth: 3, areaColor: 'rgba(201, 229, 255, 1)' } }, label: { show: true, color: '#666666', fontSize: 12, fontWeight: 400 }, emphasis: { // 鼠标移入动态的时候显示的默认样式 label: { show: true, color: '#FFFFFF', fontSize: 15, fontWeight: 600 }, itemStyle: { areaColor: 'rgba(102, 182, 255, 1)', borderColor: '#FFFFFF', borderWidth: 2 } }, layoutCenter: ['50%', '50%'], layoutSize: '150%', data: data } ] } const opt = Object.assign({}, defaultConfig, config) const { legend, tooltip, series, geo, grid } = opt const chartOpt = { grid, legend, tooltip, geo, series } return chartOpt }
export default { getSimpleMap } |
自定义弹窗主要是在tooltip的formatter里面实现,自定义好html弹窗,把params里要显示的数据显示到对应的地方就OK了。
个人喜欢直接纯html实现好设计给的弹窗样式,然后直接复制到formatter里面。每次遇到不同的设计,就修改下formatter里面的html和匹配下要显示的数据就行了。这里可以进一步封装的,有兴趣的可以试试。
页面调用
|
1 2 3 4 5 |
<chart-view class="map-view" :chart-option="mapOpt" height="100%" @click="handleMapClick" /> |
- 1、 :chart-option="mapOpt"这个是给封装的echarts地图模块的传参,接口数据要经过处理,具体看下一节
- 2、@click="handleMapClick"这里是点击地图时,对应区域的数据,用于有下一步的操作,例如地图下钻
接口数据处理
|
1 2 3 4 5 6 7 8 9 10 11 12 13 14 15 16 17 18 19 20 21 22 23 24 25 26 |
initMap(url) { mapRequest(url).then((res) => { const mapData = res.data const jsonMap = { mark: this.mapName, json: mapData }
const data = mapData.features.map((item) => { const { name, adcode } = item.properties
let hoverObj = {}
const objIndex = findElem(this.mapPopData, 'adcode', adcode) if (objIndex !== -1) { hoverObj = this.mapPopData[objIndex] } else { hoverObj = null } return { name, hoverObj: hoverObj } }) this.mapOpt = this.$eChartFn.getSimpleMap(jsonMap, data) }).catch((err) => { console.log(err, '加载地图失败') }) } |
这里对地图geojson数据和接口返回数据进行匹配处理,达到弹窗数据是对应地区数据的效果。
地图geojson数据是必有adcode字段的,所以接口数据mapPopData最好也是加上此字段,用来匹配。 上面代码里的hoverObj是匹配好的每个区域的数据,最终形成数组data,通过以下代码给封装的echarts模块传参
|
1 |
this.mapOpt = this.$eChartFn.getSimpleMap(jsonMap, data) |
具体代码可以参考echartMapTest文件夹里面的index.js文件
代码总览
涉及的文件如下(具体参考代码):
|
1 2 3 4 5 6 7 8 9 10 11 12 13 14 15 16 17 18 19 20 21 22 23 24 |
|-- public |-- data |-- 4401.json |-- mapdata.json |-- images |-- map-ic.png |-- src |-- api |-- map.js // 获取地图geojson数据、地图弹窗接口模拟数据 |-- components |-- chart |-- index.vue // 图表单文件组件,供界面调用 |-- index.js // 实现自动化导入options里的图表option |-- options // 存放各种图表的option |-- map // 地图option |-- index.js |-- views |-- echartMapTest // 实例所在 |-- index.vue |-- index.scss |-- index.js |-- utils |---utils.js |-- main.js // 全局引入echarts图表 |
代码
按代码总览的目录去代码https://github.com/liyoro/vue-skill里找着看就行了。
总结
以上,就是对echarts地图模块的封装,还有自定义弹窗的实现。使用和复用都比较方便了。
最近才发现 www.makeapie.com 停服了,挺好用的东西来的,感谢这么多年的奉献。
有需求的可转移到 PPChart http://ppchart.com/#/,算是一个替代品了